

At this point, possibly the favorite offensive statistic of the somewhat educated fan is OPS and its easy to see why. Its an easily calculated stat, you simply add on-base percentage and slugging percentage together. Its easily comparable between two players, since both stats are relatively independent of teammates. The adjusted versions of the stat are available on the internet, and the unadjusted stats are updated daily. It also helps that OPS has a good correlation to runs scored by a team, especially for a stat that isnt created by Baseball Prospectus or Bill James. Simply put, it includes patience and power and produced a compiled stat that actually seems to judge players fairly.
But OPS should be able to be improved. Logically, the main problem with OPS is the weight it gives to slugging over on-base percentage. Both slugging and OBP have a solid correlation to runs scored and produced. Most results show that there is not much of a difference between the two stats in terms of how they correlate to runs scored. However, Slugging gets a noticeably higher weight in OPS, as compared to OBP. The nature of the stats is that almost every player who is not a singles hitter is going to have a higher slugging percentage, simply because total bases add up faster than walks do. Therefore, OPS gives more influence to slugging than to OBP.
There are two solutions that jump out at me right away to test out. The first is a relatively obvious one, simply multiply OBP by a specific number to give it equal weight to slugging, and add the results together to get an Equal OPS (EOPS for the purposes of the article). For the numbers presented (based on 2006 team statistics), Ill make the multiplier 1.29, as that number multiplied by the league average OBP would equal league average slugging. That would logically equalize the value of slugging and OBP and produce a state more likely to correlate to runs.
The second solution is a bit more exploratory on my part. The essential idea is that slugging would also recognize walks. Currently, slugging is Total Bases divided by At-Bats, a quick and easy calculation. However, we all know that walks count just the same as a single in terms of what total bases would calculate. Total bases doesnt account for if a runner on base takes an extra base, rather simply what the hitter accomplishes. Therefore, I will also count a walk and a HBP as one total base, equal to a single. Additionally, stolen bases are not added in and neither are CS. The new formula would be (TB+BB+HBP+SB-(2*CS))/(PA). I had a tough time deciding between CS and 2*CS, mostly because the team only loses one overall base when a player is CS from 1st to 2nd. However, since I am comparing for runs, and the break-even point is 66%, 2*CS seems more accurate. I will call this SLGBB (Slugging with BB) and AOPS (Adjusted OPS). AOPS is simply OBP + SLGBB.
Since I have no real statistical skills and cant come up with actual statistical terms or concepts, my ranking system will use the ranks of the teams over the entire major leagues. For instance, if a team is ranked 5th in OPS, 3rd in EOPS, and 8th in AOPS, and they ranked 4th in runs, the EOPS and OPS would equally correlate and AOPS would be way off. Also, Im only looking for a stat that doesnt require a degree in mathematics to understand, so my formulas will try to be accessible.
Also, since this is simply exploratory, I will only do one year, so be warned that this is a small sample statistically and that if I tested 2003, the results could and probably would be different, as if I tested 1947.
OPS Results
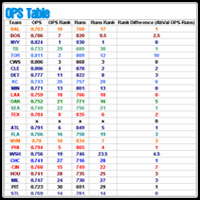
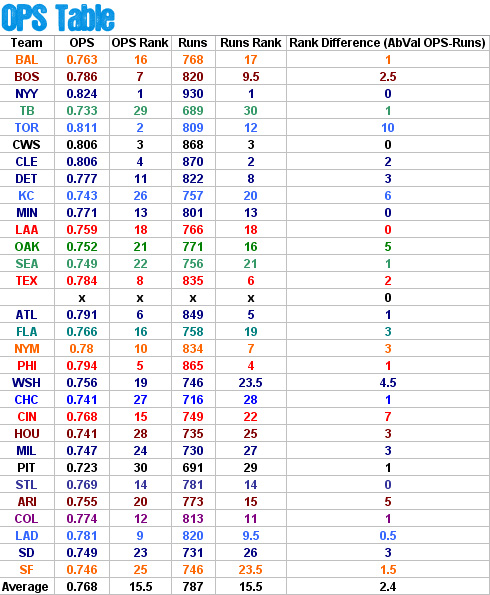
The OPS Results turn out a good correlation to runs from the 2006 data. On average, without removing any outliers (Torontos ten rank difference is the most notable), there was a 2.4 difference in rank, on average. Five teams turned out to be exactly the same in both OPS and Runs rankings, six if you include tied teams as either ranking (Los Angeles was 9th in OPS and Tied for 9th in runs, which I made 9.5). The data tended to be more accurate for the teams at the top of the OPS and runs ranking as compared to the teams near the bottom and in the middle. That is most likely due to the 40-point difference between 1st and 10th, and the 50-point difference between 11th and last, which resulted in closer raw differences between the teams near the middle and bottom. All the perfect teams were within the Top 18 teams, which supports that idea.
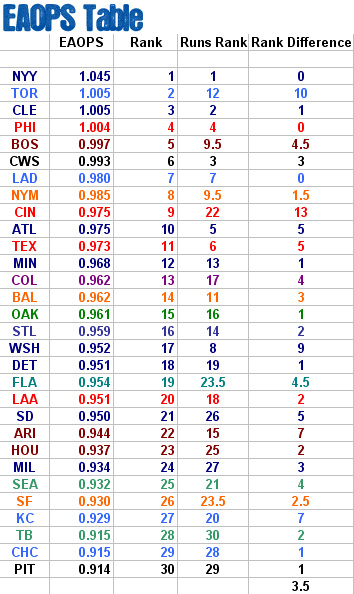
EOPS Results
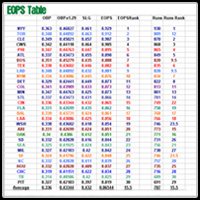
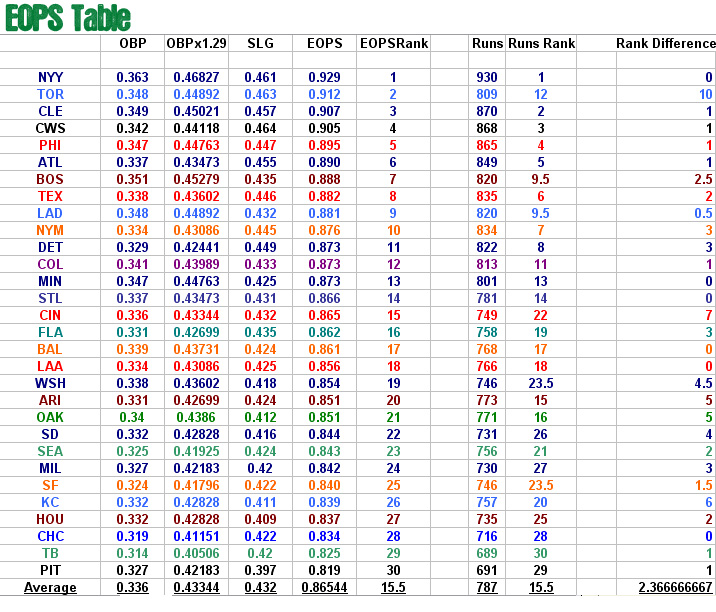
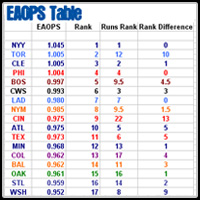
The EOPS numbers look very similar to the OPS numbers. They have the same major outliers (Toronto at a 10-rank difference, Cincinnati at a 7-rank difference, and Kansas City at a 6-rank difference). In fact, with the OPS and AOPS columns sorted by rank, there were no differences greater than one spot between the two calculations. For instance, Florida and Baltimore flipped spots from the OPS to the EOPS, as did a couple other teams, but all in all, the equaling of the weight of the two numbers had little impact on the overall results in comparison. The overall rank difference was a total of 71, meaning each team was off by an average of 2.37 ranks. Essentially, if any one team were off by one more ranking in the EOPS ranks, the correlation would be equal. There was not a major difference between these two ranking systems and the effort to calculate the EOPS of a team is unnecessary when comparing them, as OPS will be just fine in comparison.
AOPS Results
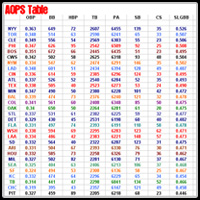
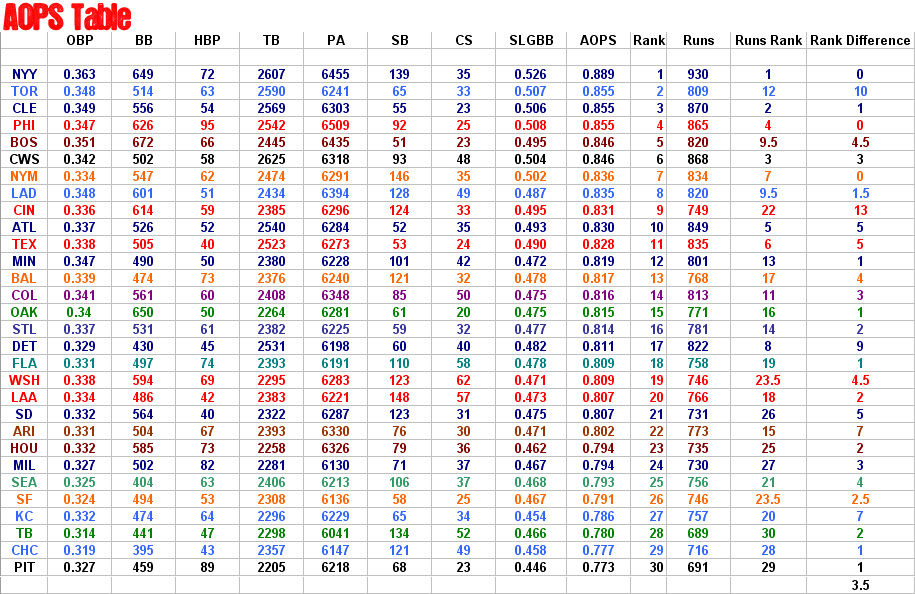
The AOPS Numbers, which left OBP alone while tinkering with slugging, were a huge flop. The average rank difference was 3.5, basically a full rank more than either OPS or EOPS. The formula maintained the same factors that made Toronto and Kansas City exceptions to the rule. However, it simply inflated the problems of teams like Cincinnati (which ballooned from a seven rank difference to a thirteen rank difference) and Arizona.I thought that adding the factors of walks and HBPs into slugging would have made the results more concurrent, but the rankings show significant regression in terms of accuracy when using AOPS.
EAOPS Note
I did a quick calculation combining the general idea of the two test OPSes. First I determined AOPS, and then I found the number to multiple OBP by to make it equal. The produced the EAOPS results. The results were the exact same as the AOPS result. That means that the increased difference between SLGBB and OBP was not the culprit. The EAOPS multiplier was 1.43, resulting in a formula of (1.43*OBP)+(AOPS).
Conclusion and a calculation of Ratio
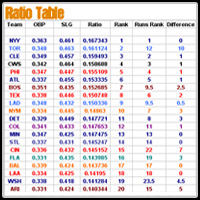
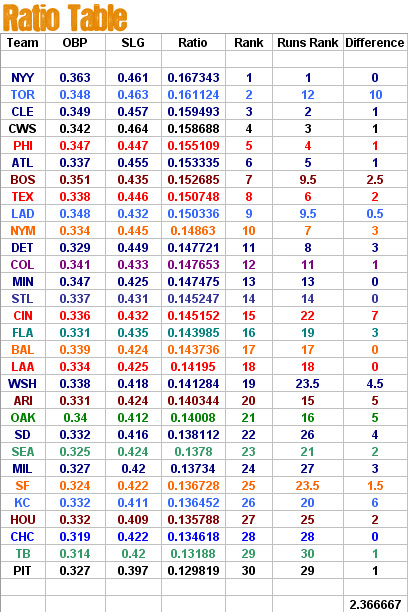
In conclusion, in spite of my best efforts, OPS either has more correlation or equal correlation to runs as compared to my test OPSes. A quick calculation of Ratio (SLG*OBP) produced results better than OPS or EOPS, but not significantly by any means, with an average rank difference of 2.37. The Ratio Results are placed above this paragraph
OPS is a flawed stat, but with a very small average difference between the real runs produced and the OPS predicted runs produced and the lack of a better option found among my calculations, OPS seems like a fair tool to use when predicting future success in terms of team runs scored.
Thanks to Mission for making the tables color coded and available for use in the article. Comments are welcome.